Buy-Side and Sell-Side Liquidity (BSL/SSL) Explained
If market structure tells you which way price is going, liquidity tells you why it's going there. In the ICT/SMC method, that second question matters more: price doesn't move randomly between levels — it travels from one cluster of orders to the next. Those clusters are, above all, stop-losses — yours, mine, and those of thousands of other traders — resting above old highs and below old lows. This article is the pillar of the entire liquidity series: we explain what Buy-Side and Sell-Side Liquidity are, why the market regularly "hunts" stops, and how to stop being fuel for other people's positions on BTC and ETH.
What liquidity in the market is
Liquidity, in the simplest terms, is the availability of willing buyers and sellers at the current price. A liquid market is one where a large order can be filled without violently moving the price. And this is where the big players' problem begins: a fund or market maker looking to buy tens of millions of dollars' worth of BTC can't just click "buy at market" — an order that size would push the price against them.
A large player needs the other side of the trade in size and in one place. And where on the chart does massive selling appear in a single moment? Where the stop-losses of long positions get triggered — that is, below old lows. Where does massive buying appear? Where the stops of short positions get triggered — above old highs. In ICT terminology, liquidity is precisely those resting orders pooled above highs and below lows, not some abstract "volume".
This is the source of the method's core thesis: liquidity is the primary cause of price movement. Price doesn't "bounce off resistance" — price is delivered to the places where orders sit, consumes them, and moves on to the next cluster on the opposite side. Whoever doesn't see this becomes the liquidity themselves.
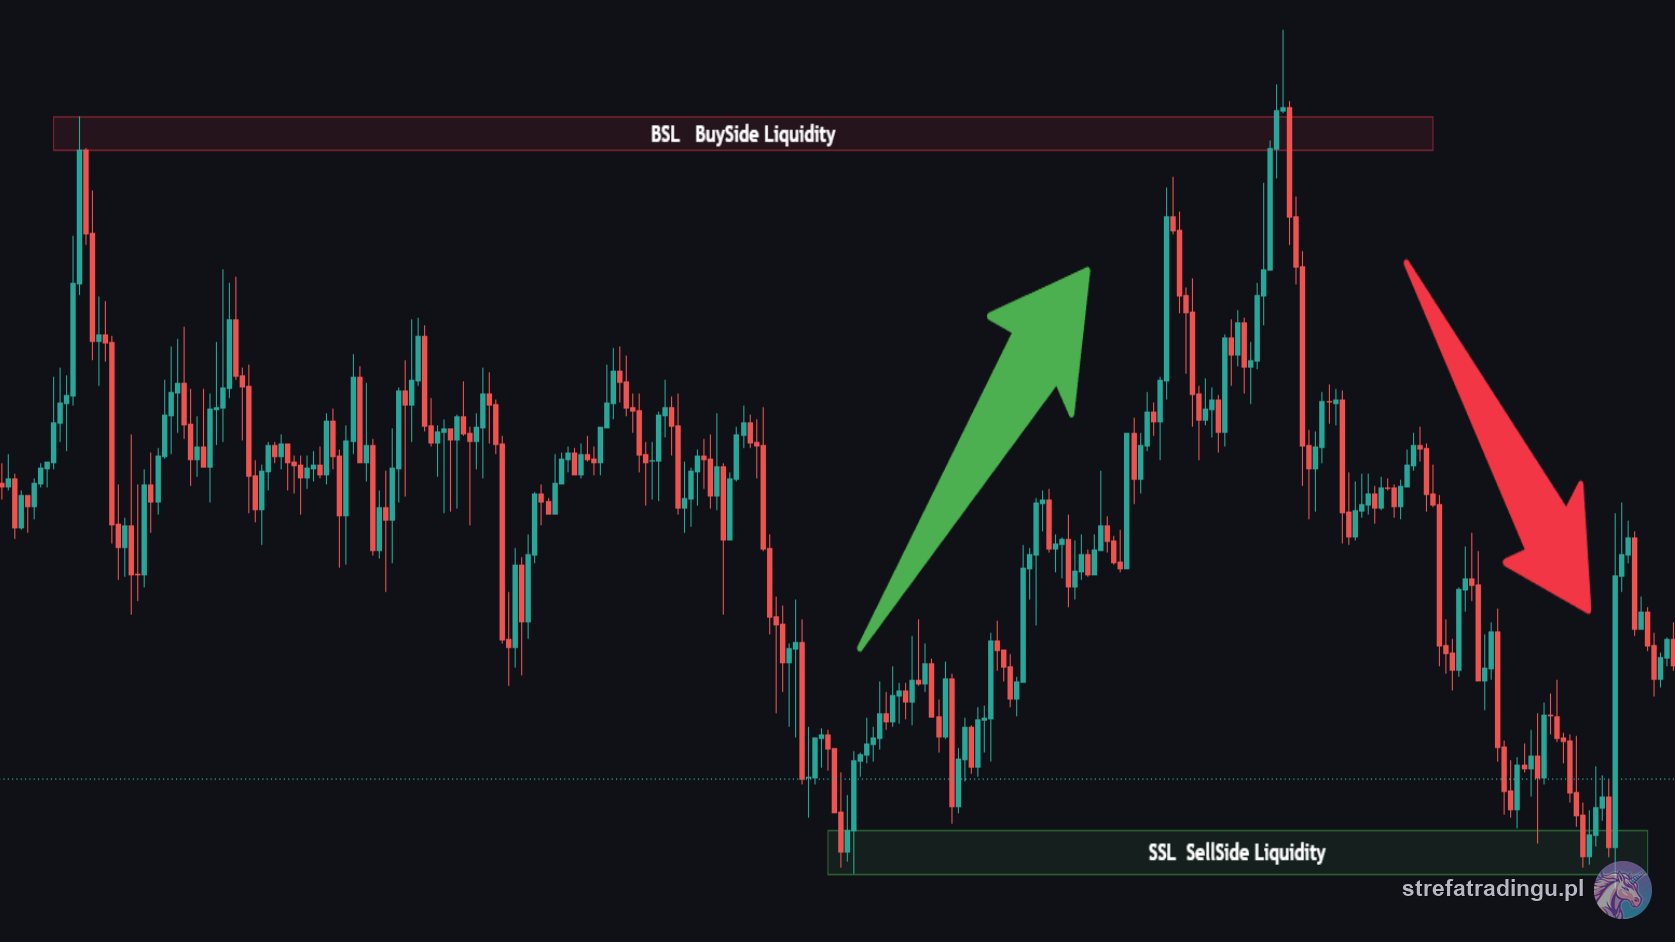
Buy-Side Liquidity — liquidity above the highs
Buy-Side Liquidity (BSL) is a cluster of buy orders waiting above old highs. Where do they come from? Two sources:
- Stop-losses on short positions. Everyone who sold protects the position with a buy stop above the high, "because it won't go any higher". The more obvious the high, the more stops hang above it.
- Breakout traders' orders. A sizable group trades breakouts: they place a buy stop just above the high to "catch the move". Their entries are exactly the same buy orders in exactly the same spot.
The high of the day, the high of the week, a series of equal highs on BTC — above each of these levels a pool of buy orders keeps growing. When price breaks through, the stops and breakout entries turn into market buying. And that's the moment when smart money can sell a large position at an excellent price — into the wave of everyone else's buying. That's why you see the pattern so often: a break of the high, a candle of euphoria, then a sharp drop. It's not "senseless manipulation" — it's the consumption of BSL.
Sell-Side Liquidity — liquidity below the lows
Sell-Side Liquidity (SSL) is the mirror image: a cluster of sell orders below old lows. It's made up of stop-losses on long positions (every buyer tucks their stop under a low) and sell stop orders from players betting on a downside break.
Price dipping below an old low triggers an avalanche of selling — and it's precisely into that avalanche that institutions can buy without pushing the price up. A classic on ETH: price slips a few dozen dollars below an obvious low from last week, a wick, a return into the range, and a rally north. Those who "got stopped out perfectly at the bottom" just handed their coins to the people who understand this mechanic.
A practical rule worth engraving in steel: with a bullish bias on the higher timeframe, expect SSL to be taken (a dip below an old low) before the market moves up. With a bearish bias — expect BSL above an old high to be taken before it moves down. The market fuels up first, then drives.
How to identify liquidity levels step by step
Mapping liquidity is a mechanical routine you run before every session:
- Establish the HTF context. On D1 and H4, determine the structure: bullish, bearish, or consolidation. Without it, you don't know which side of the liquidity is "on the target list". If you can't read structure yet, start with the article on market structure.
- Mark the previous day's high and low. These are the freshest pools of BSL (above the high) and SSL (below the low) — the market reaches for them most often.
- Mark the previous week's high and low. Higher-order levels; the longer they stand untouched, the more orders have accumulated above/below them.
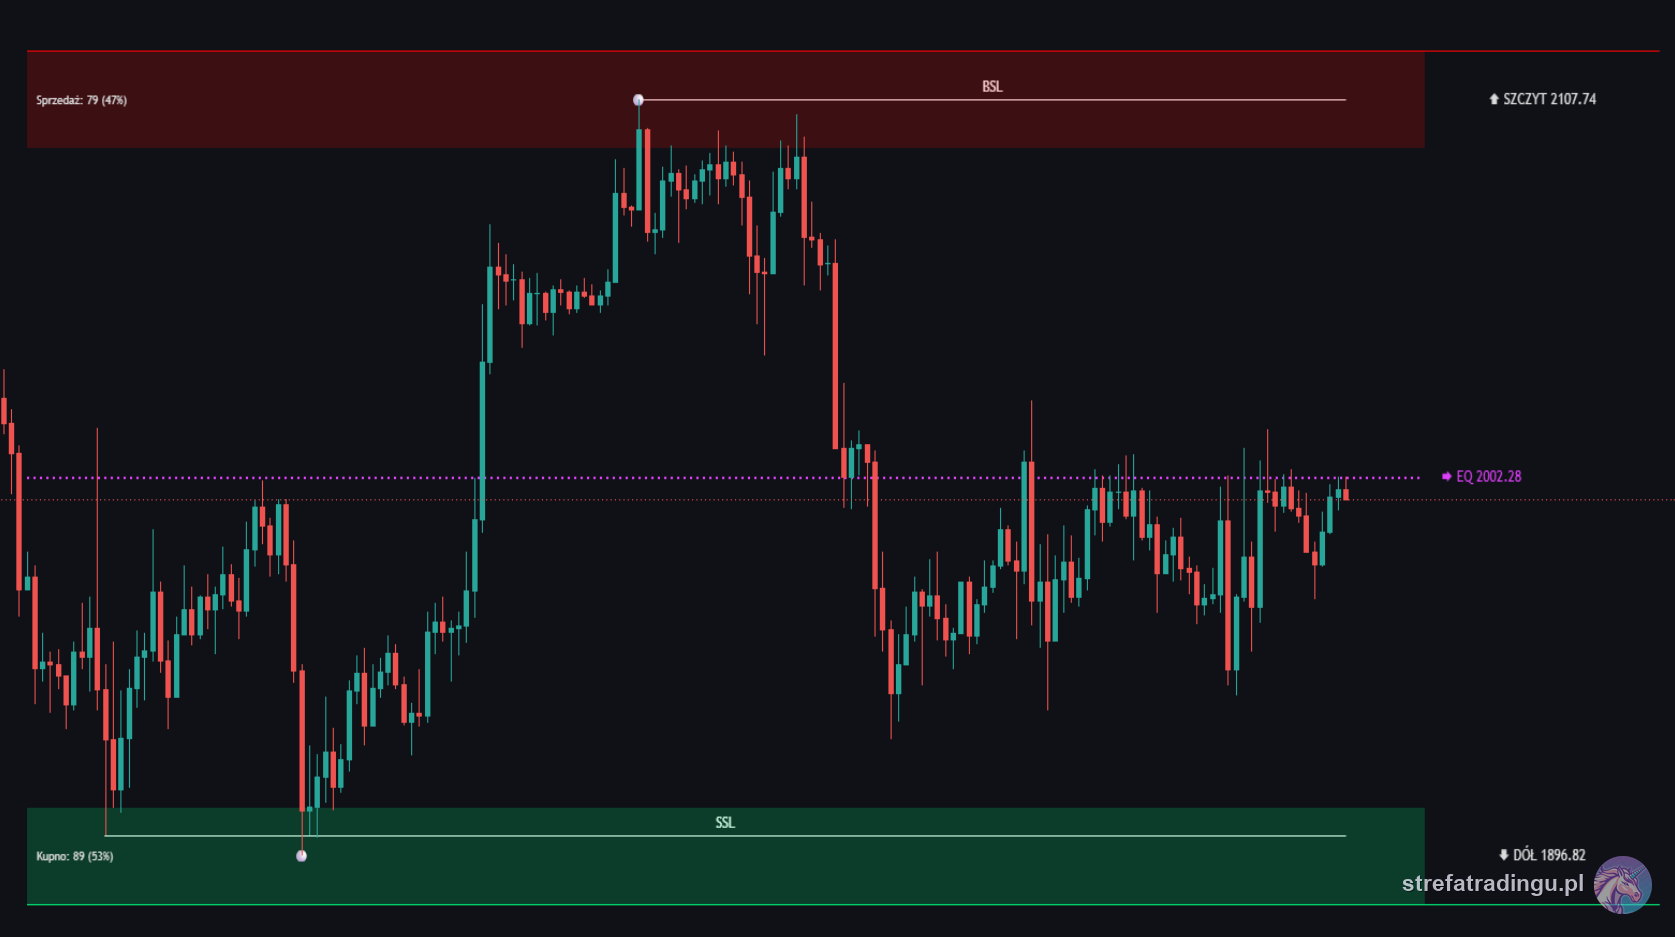
- Find equal highs and equal lows. Two or three highs at a similar level look like "strong resistance" — which means hundreds of stops hang above them. These are first-class magnets; we break them down in detail in the piece on liquidity pools.
- Determine the next target (draw on liquidity). Ask: which pool — upper or lower — aligns with the HTF bias and is bigger? That's most likely where price is headed.
- Watch the reaction at the level. A wick through the level and a close back inside the range is a sweep — liquidity being taken; a close beyond the level with momentum is a run — continuation.
In practice you don't have to draw all of this by hand — our SRL indicator automatically marks the key highs, lows, and zones the market hasn't reached for yet.
How to use liquidity in trading
A liquidity map alone is not a trading system — it's a layer of context you overlay on structure. The HTF→LTF scheme looks like this:
Step 1 — bias from the higher timeframe. D1/H4 tells you which side of the liquidity the market will likely take "against the grain" and which it will consume with the target move. Bullish structure? A dip below an old low is a potential long opportunity for you, not a panic signal.
Step 2 — wait for the level to be taken. You don't enter because price "is close" to the pool. You wait until it actually breaks the level and shows a reaction: ideally a wick through the low/high and a close back inside the previous range.
Step 3 — confirmation on the LTF. You drop to M5–M15 and wait for a structure shift in your direction — a CHoCH or MSS after the sweep. Only that distinguishes "they took the stops and we're turning" from "we're breaking through and going further".
Step 4 — entry, stop, target. Entry on the retest of the zone left by the reversal move (FVG, order block). Stop beyond the swept extreme with a small buffer — not exactly on it, because a second test of the wick will take you out. Target: the opposite liquidity pool. Did they take the SSL below the low? The natural magnet is the BSL above the nearest significant high.
Notice the elegance of this setup: liquidity gives you the entry (the swept pool), the invalidation (beyond the swept extreme), and the target (the opposite pool) all at once. Three elements of the plan from one concept.
Most common mistakes
- Treating every high and low as a liquidity pool. What counts are significant, untouched levels: the high/low of the day, of the week, clear equal highs/lows. If you mark everything, you're marking nothing.
- Front-running the sweep. Positioning "just under the level, because they're about to take it" strips the trade of its entire edge. The sweep is supposed to happen — you're supposed to react to it, not guess it.
- Ignoring the HTF bias. BSL taken in a bearish structure is a setup for downside continuation; the same sweep in a bullish structure is often a run, after which price keeps flying higher. Context decides direction, not the wick alone.
- Confusing the pool with the sweep. The pool is sleeping orders; the sweep is the act of collecting them. A pool can exist for weeks — the setup only forms when price reaches for it.
- Stop exactly at the swept level. If the market reached for it once, it can reach a second time, a few ticks deeper. A buffer isn't cowardice — it's part of the model.
- Trading every sweep. The cleanest reversals happen at structural extremes, after a significant pool is taken, in line with the bias. A sweep of some micro-level in the middle of a range is noise.
Liquidity is the answer to the question every trader eventually asks: "why did the market take out my stop to the tick and reverse?". Not because your broker is watching you — because your stop sat exactly where everyone else's stops sat, and a cluster like that is fuel for large orders. We break down the next layers of this mechanic in the articles on liquidity pools, the difference between a sweep and a run, and internal and external range liquidity (IRL/ERL).
FAQ
What is Buy-Side Liquidity (BSL)?
What is Sell-Side Liquidity (SSL)?
Why does the market hunt stop-losses?

Trader and founder of Strefa Tradingu. He’s been breaking crypto down on YouTube for years — no hype, no signals, with a focus on market structure and risk management.
🎁 Grab Strefa’s free TradingView indicators
Drop your email — we’ll send you links to our free TradingView indicators plus a no-fluff starter kit. Zero spam.
You’re joining the Strefa Tradingu list. Unsubscribe with one click, anytime.Check your inbox (and the Spam/Promotions folders) and add us to your contacts.