Market Structure — Uptrend, Downtrend and Consolidation
Before any Order Block, FVG or liquidity zone shows up on your chart, something far more fundamental has to be there first: market structure. It tells you whether the market is rising, falling or going nowhere — and it's where every analysis in the ICT/SMC method begins. If you can't read structure, the rest of the concepts are just colorful rectangles on a chart. In this article — the pillar of the entire structure section — we break the topic down to its parts: what structure is, what its three states look like, and how to turn it into concrete decisions on BTC and ETH.
What is market structure
Market structure is the way price arranges its successive highs (swing highs) and lows (swing lows) on the chart. Nothing more, nothing less — no indicators, no moving averages, just pure price action. From the arrangement of these turning points you read the state the market is in: an uptrend, a downtrend, or consolidation.
In the ICT method, structure is the foundation. Every other concept — the Break of Structure (BOS), the Change of Character (CHoCH), the Market Structure Shift (MSS), Order Blocks and Fair Value Gaps — only makes sense once you know which way the structure is built. Structure decides whether you're looking for longs, shorts, or sitting on your hands.
Every structural high and low is a so-called swing — a three-candle formation in which the middle candle has the highest high (a swing high) or the lowest low (a swing low). We break it down in detail in the article on the swing low formation. For this text, it's enough to know that structure is made of exactly these points, not random wicks.
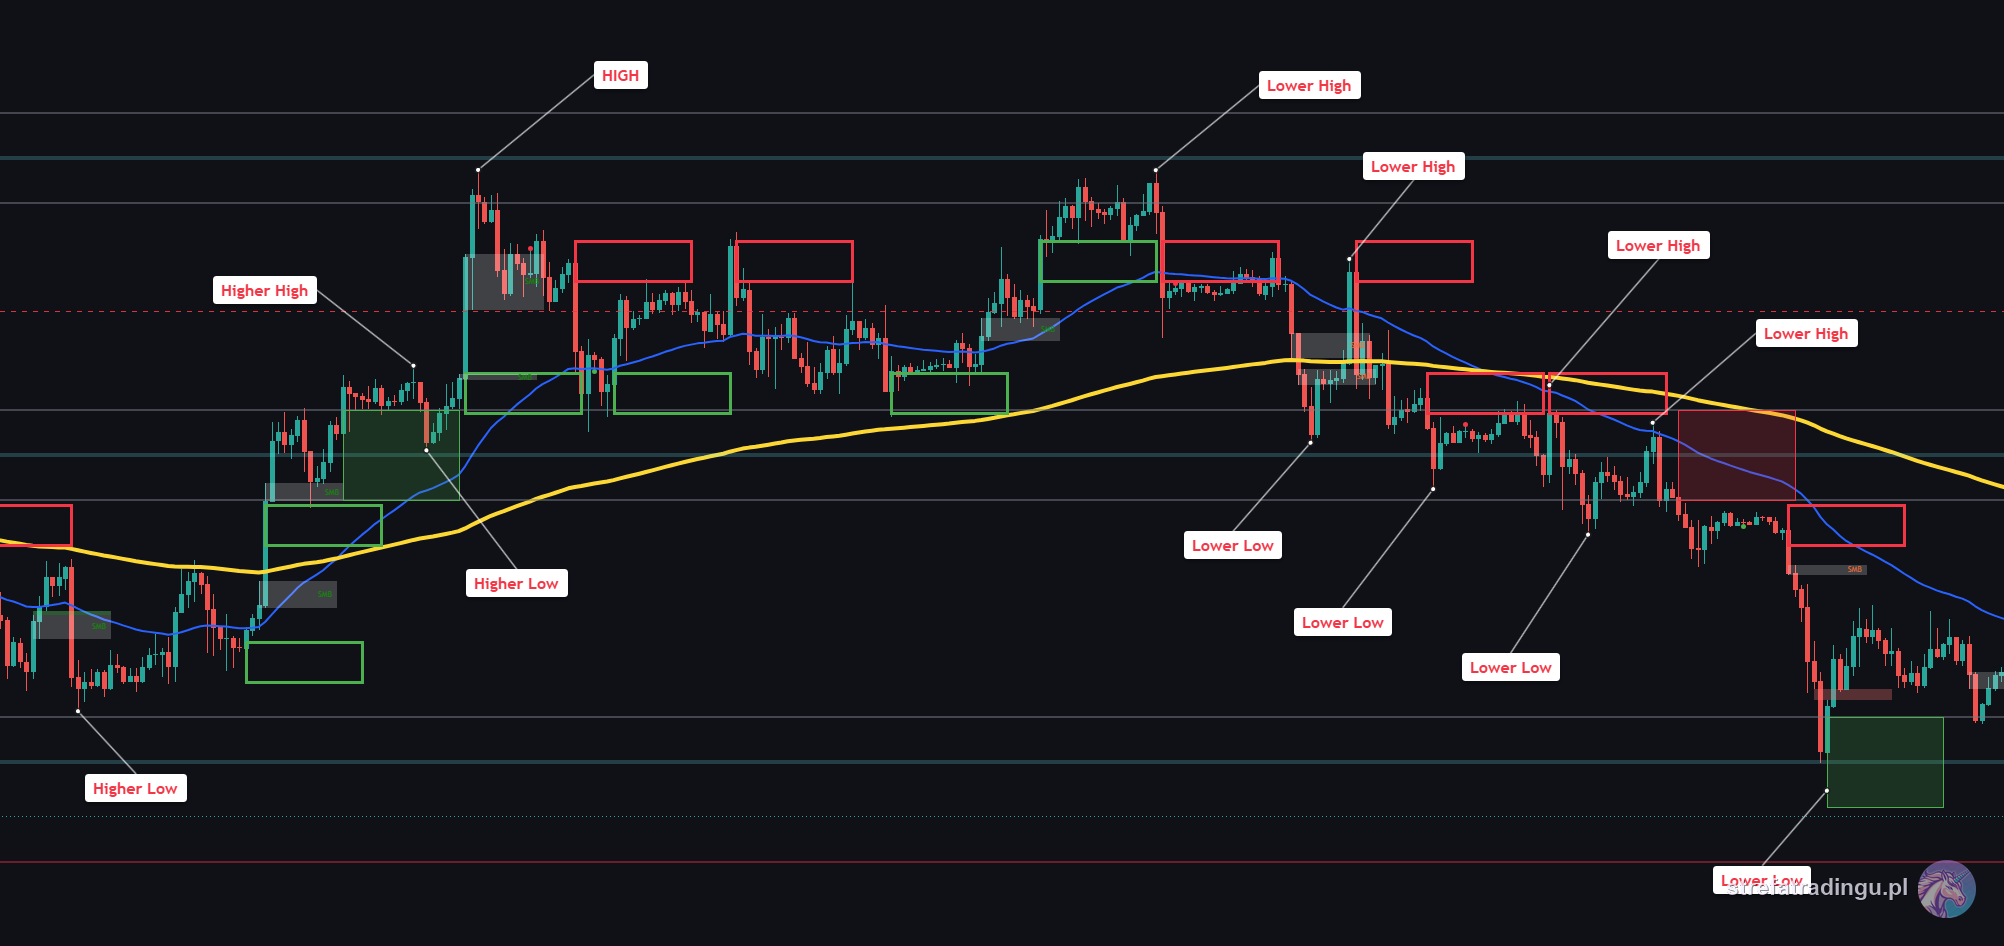
The three market states: uptrend, downtrend, consolidation
At any given moment, the market can only be in one of three states. Sounds trivial, but most beginner traders lose precisely because they run a trend strategy inside a consolidation, or catch falling knives against a bearish structure.
An uptrend is a series of higher highs (HH) and higher lows (HL). Every new high takes out the previous one, and every pullback stops above the previous low. As long as price doesn't break the last higher low, the bullish structure is intact — and the default play is long. That's what BTC looked like in the strong bull-market waves: highs broken one after another, shallow pullbacks, every low printed higher.
A downtrend is the mirror image: a series of lower highs (LH) and lower lows (LL). Price keeps breaking lows, and the bounces fade lower each time. Until the last lower high gets taken out, the structure remains bearish and you look for shorts — or at the very least you stop catching longs "because it's cheap now." On ETH in a bear market, this pattern can grind on for months.
Consolidation (a range) is a state where price builds no series at all — it bounces between a clear range high and range low. The upper and lower boundaries collect liquidity from both sides, and breakouts frequently turn out to be fake. Trend-following doesn't work in a range: you either trade boundary to boundary on a lower timeframe, or you wait for a credible break of structure that points to the new direction.
How to identify structure step by step
Reading structure is a mechanical process. Here's a procedure you can repeat on any chart:
- Pick your context timeframe. Start on D1 or H4 — structure from a higher timeframe outranks the lower ones and sets the direction.
- Mark the significant highs and lows. Look for three-candle formations: a middle candle with the highest high is a swing high, a middle candle with the lowest low is a swing low. Ignore the micro-moves that don't form a full swing.
- Connect the points into a series. Ask yourself two questions: are the successive highs printing higher or lower? Are the successive lows printing higher or lower? HH+HL = uptrend, LH+LL = downtrend, no series = consolidation.
- Find the last decision point. In an uptrend, it's the last higher low — breaking it invalidates the structure. In a downtrend, it's the mirror image: the last lower high.
- Drop down a timeframe and repeat. On H1 and M15, structure may look different from D1 — and that's normal. A pullback on a high timeframe is often a fully-fledged trend on a low one.
Step 5 is where most people trip up. When BTC is printing higher lows on D1 while breaking structure to the downside on M15, there's no contradiction: the low timeframe is showing a correction inside the higher structure. Top-down analysis always starts at the top — the lower timeframe is only there to refine an entry in the direction the higher one dictates.
In practice, you don't have to mark everything by hand — our SRL indicator draws the highs, lows and structure breaks automatically, so you instantly see what state the market is in.
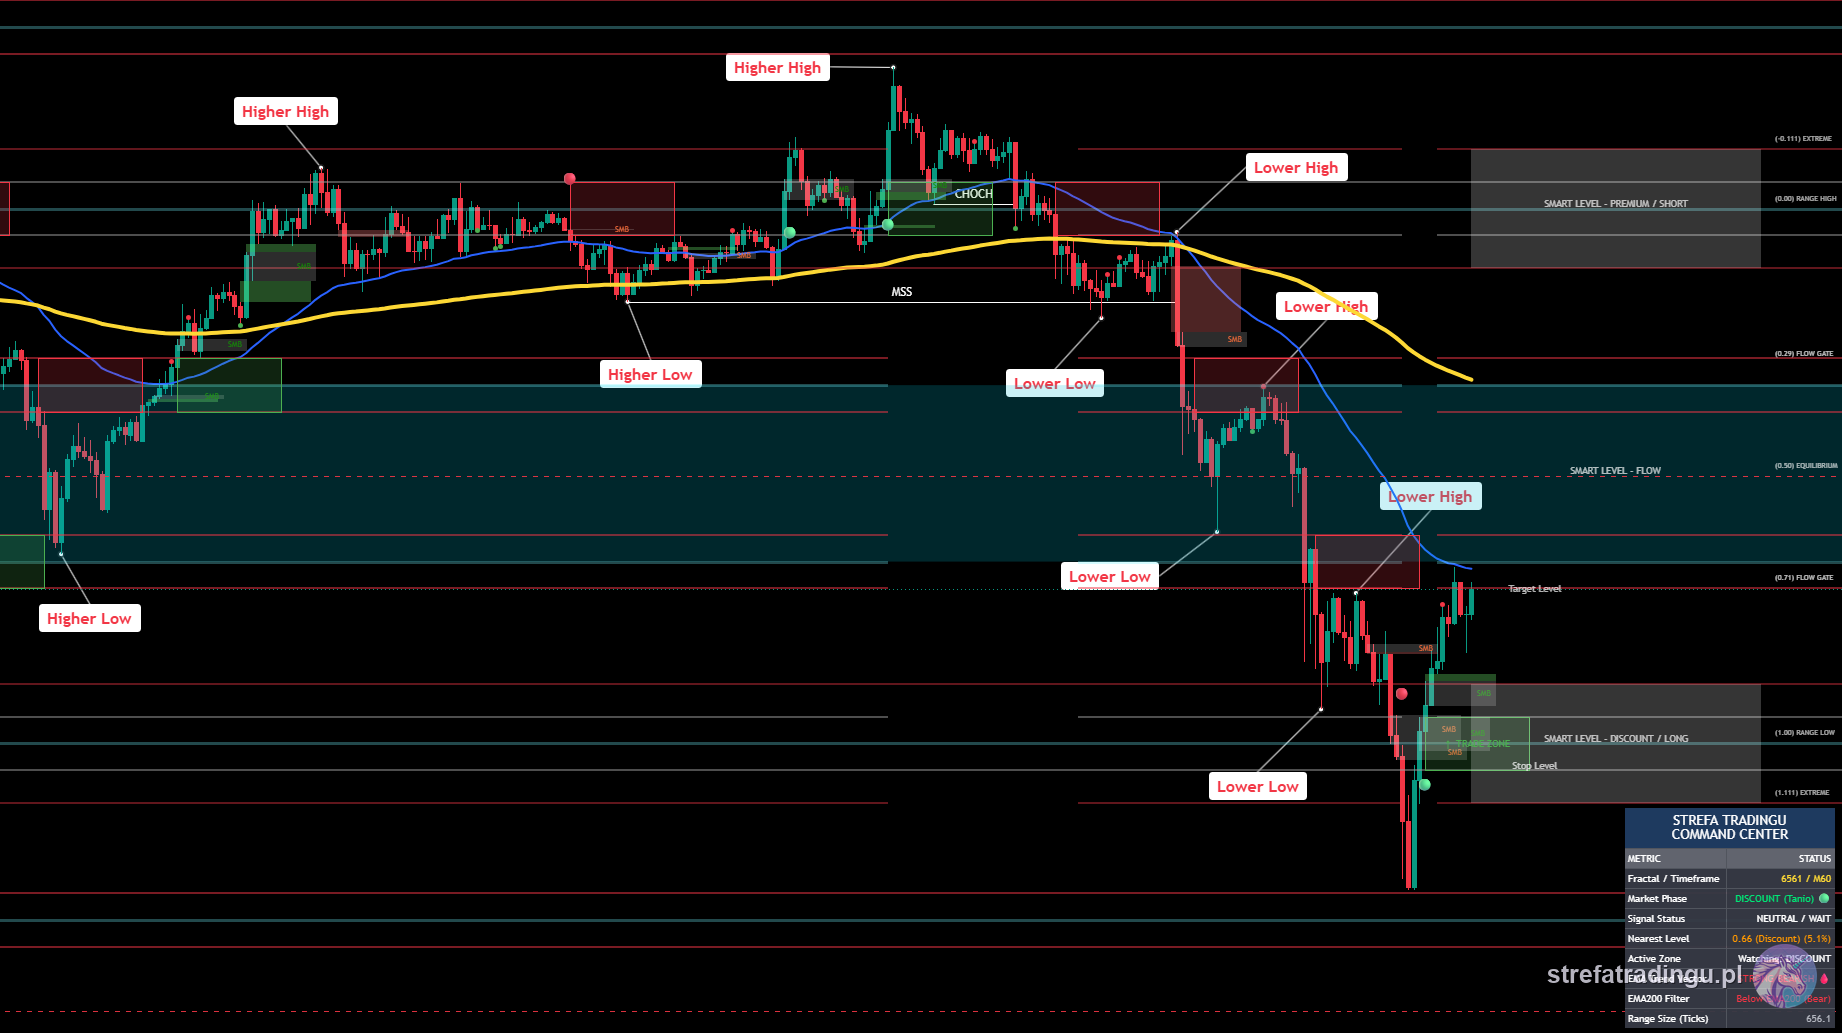
How to use market structure in your trading
Structure by itself is not an entry signal — it's a filter that tells you what you're allowed to look for. The practical framework looks like this:
Step 1 — HTF context. On D1/H4 you establish the market state. Bullish structure? You're only interested in longs. Bearish? Shorts only. Consolidation? You wait, or trade the range on small size.
Step 2 — reaction level. Inside the structure, you look for a place where price has a right to turn: the area around the last higher low, an Order Block zone, an FVG. In an uptrend you buy the pullbacks, not the breakouts — after breaking a high, price usually comes back for liquidity before moving on.
Step 3 — LTF trigger. When price reaches the level, you drop to M15/M5 and wait for the lower timeframe to break structure in your direction as well. This HTF→LTF handoff means you're not buying "because it dipped," but because the younger structure confirmed the older one.
Step 4 — management. You tuck your stop loss behind the structural low (for a long) or high (for a short) — because only breaking that point genuinely invalidates your scenario. Your target is the next structural level: the previous high, equal highs holding liquidity, the opposite boundary of the range.
Notice that in this framework, structure answers three questions at once: whether to trade (market state), where to trade (structural levels), and when to admit you're wrong (the decision point breaking). No oscillator gives you that package.
Most common mistakes
- Reading a single timeframe. M15 structure against D1 structure is a recipe for trading against the current. Always top-down: D1/H4 first, then lower.
- Treating every wick as a break. A break of structure requires a candle close beyond the level. A lone wick is usually a stop-loss hunt, not a change in structure.
- Marking every micro-move as a swing. If your chart looks like a hedgehog, you're marking too much. Only count full three-candle formations and points that actually break something.
- Trend-trading a consolidation. Range breakouts without confirmation are the most common fakeouts in crypto. No HH/HL or LH/LL series — no trend, no trend trade.
- Confusing continuation with reversal. Breaking a high in an uptrend is a BOS — continuation. Breaking a higher low is a CHoCH — possible reversal. Mixing these two events up flips the direction of your position.
- No invalidation point. If you don't know which low or high kills your scenario, you don't have a scenario — you have an opinion.
Market structure is the alphabet in which every other ICT concept is written. You'll learn the next letters in the articles on BOS, CHoCH and MSS — but come back to this text whenever the chart stops making sense. The answer is almost always: look at the structure one timeframe higher.
FAQ
What are the three states of market structure?
What is the best timeframe to read market structure on?
How is market structure different from BOS and CHoCH?

Trader and founder of Strefa Tradingu. He’s been breaking crypto down on YouTube for years — no hype, no signals, with a focus on market structure and risk management.
🎁 Grab Strefa’s free TradingView indicators
Drop your email — we’ll send you links to our free TradingView indicators plus a no-fluff starter kit. Zero spam.
You’re joining the Strefa Tradingu list. Unsubscribe with one click, anytime.Check your inbox (and the Spam/Promotions folders) and add us to your contacts.