Fair Value Gap (FVG) — A 6-Step Trading Strategy
If the ICT method has one concept everything starts from, it's the Fair Value Gap. It's the easiest formation to spot in the entire smart money arsenal: three candles and a gap that price "forgot" to close. And at the same time — the foundation that Order Blocks, displacement, inversions and half of ICT's entry models are built on. In this article, the pillar of our entire FVG section, we take the gap apart piece by piece: what it is, how to mark it correctly and how to build a complete six-step trade plan around it — with examples on BTC and ETH.
What Is a Fair Value Gap
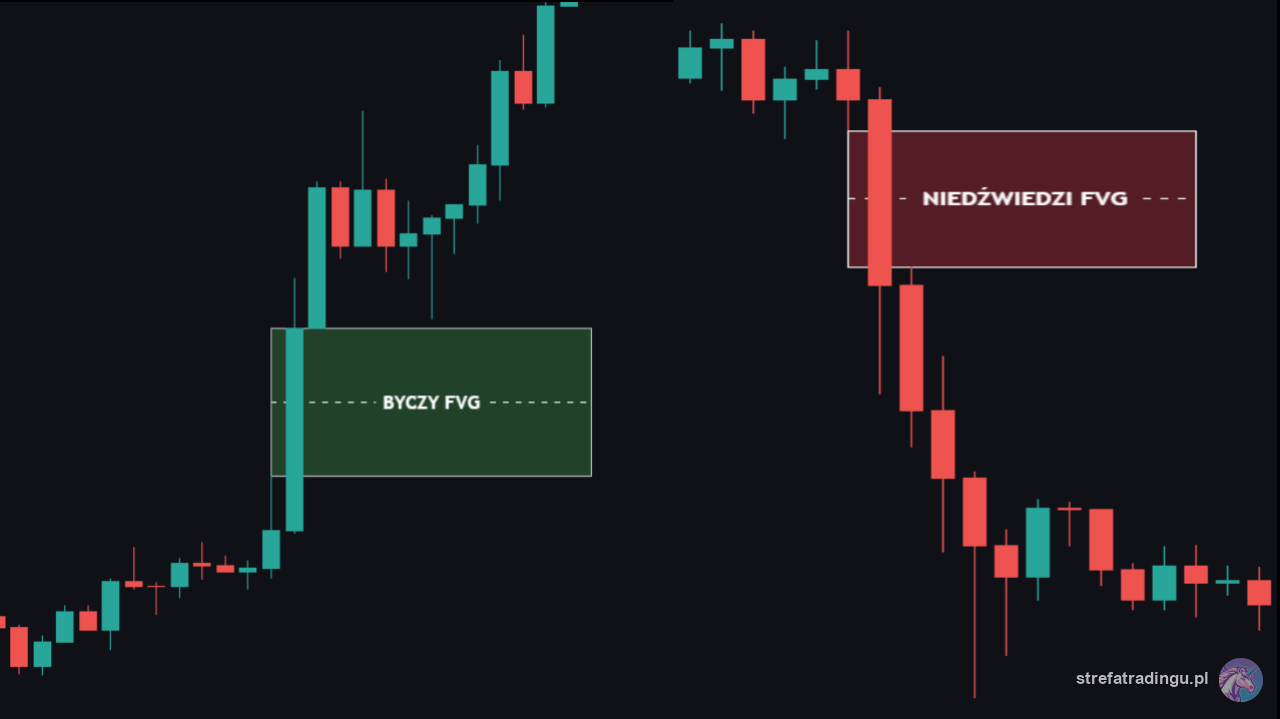
A Fair Value Gap (FVG) is a formation of three consecutive candles in which the middle candle has a body large enough, and moves fast enough, that empty space is left between the wick of the first candle and the wick of the third — a price gap the market flew through in one direction without ever trading it from both sides.
Where does the name come from? The market strives to price every level fairly — meaning both buying and selling should occur in a given area. When the middle candle of the formation is the result of a violent, one-sided move (called displacement in ICT — a conviction move), part of the price range gets serviced by only one side of the market. The result is an imbalance: an area of inefficient pricing. And that is exactly why the gap acts like a magnet — price very often comes back into it to rebalance the earlier one-sided delivery, and only then continues the move.
An FVG comes in two flavors:
A bullish FVG forms in an up move. The gap stretches between the high of the first candle's wick and the low of the third candle's wick. When price later drops into this area, the gap acts as support — that's where we look for longs.
A bearish FVG forms in a down move. The gap stretches between the low of the first candle's wick and the high of the third candle's wick. Price returning into this area is potential resistance and a place to look for a short.
In ICT nomenclature a bullish FVG is called a BISI and a bearish one a SIBI; you'll find the full expansion of these acronyms in the article on SIBI and BISI.
How to Identify an FVG Step by Step
Marking a gap is a mechanical procedure — after a few days of practice you'll do it in seconds:
- Find a large candle. Look for a candle with a body clearly bigger than its surroundings and small wicks. That's candle number 2 of the formation — the carrier of displacement.
- Look at the candle before it and after it. The formation consists of exactly three candles: candle 1 (before the move), candle 2 (displacement), candle 3 (after the move).
- Check that the wicks don't overlap. In a bullish FVG the upper wick of candle 1 and the lower wick of candle 3 must not overlap. If they intersect — there is no gap; the area has been traded from both sides.
- Mark the gap. For an up move: a rectangle from the high of candle 1 to the low of candle 3. For a down move: from the low of candle 1 to the high of candle 3.
- Extend the zone to the right. The gap stays active until price fills it. A fresh, untouched (unmitigated) gap is worth far more than one price has already tested several times.
An important nuance: the gap is measured wick to wick, not body to body. It's a common beginner mistake — marking the space between the bodies and getting a zone wider than the actual imbalance.
Drawing rectangles by hand across several timeframes at once gets tedious — our SRL indicator detects and draws FVGs automatically, including flagging which gaps are fresh and which are already filled.
How to Trade an FVG — the 6-Step Strategy
The gap alone is not a signal — it's a zone. It only becomes a signal once you build context around it. Here is the complete trade flow:
Step 1 — establish direction on the higher timeframe. Before you look at any gap, open the daily and H4 and answer the question: is the market printing higher highs and higher lows, lower ones, or sitting in consolidation? You'll find the basics in the article on market structure. In bullish structure you only care about bullish FVGs; in bearish structure — only bearish ones. Trading a gap against the higher timeframe is the most common reason this concept loses money.
Step 2 — define the premium and discount zones. Stretch the range of the last significant swing and split it in half. In an uptrend the valuable gaps are in the lower half of the range (discount — you buy cheap); in a downtrend, gaps in the upper half (premium — you sell expensive). An FVG in the middle of nowhere is a zone with no edge.
Step 3 — find displacement. Look for a large conviction candle: full body, small wicks, a clear break beyond the range of the previous candles. The stronger the move, the stronger the gap — you'll find the full strength classification in the article on valid vs weak FVGs.
Step 4 — mark the gap and wait. Draw the zone between the wick of candle 1 and the wick of candle 3 and… do nothing. You don't chase the move. You wait for price to come back to the gap on its own. On BTC on the M15 this can take anywhere from fifteen minutes to several hours; some gaps will never be filled — and that too is information (the move was so strong the market didn't need a correction).
Step 5 — drop down for confirmation. When price reaches the gap, switch to M5/M1 and wait for a signal that the zone is actually being defended: a market structure shift (MSS) in your direction or a clear rejection of price. Merely touching the gap is not enough — without confirmation you're stepping in front of a falling knife.
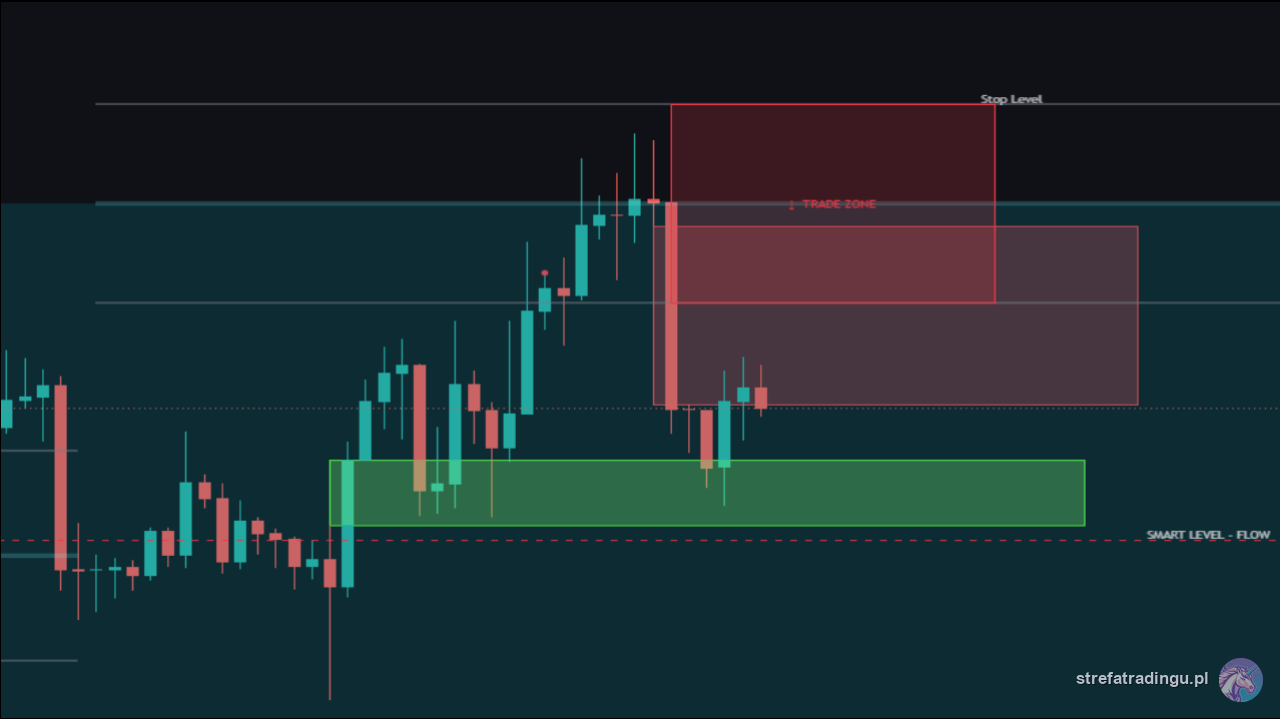
Step 6 — entry, stop and target. Entry: on retests after confirmation, classically around the midpoint of the gap, i.e. the Consequent Encroachment level. Stop loss: behind the opposite edge of the gap with a small buffer — not right at the edge, because that's where stops get hunted on the second test. Target: the nearest liquidity pool in the direction of the trade — the previous high/low, equal highs, or the next higher-timeframe gap.
A real-market example: BTC in bullish structure on the H4 breaks a local high with a displacement candle, leaving a bullish FVG on the M15 in the discount zone. Price pulls back into the gap over two hours, prints a structure shift up on the M5 and bounces. Entry at the midpoint of the gap, stop below its lower edge, target at the liquidity above the last high — a textbook 1:3 trade.
Which Timeframes and Markets to Hunt Gaps On
FVGs exist on every timeframe — from the M1 to the weekly chart — but different timeframes play different roles. A gap on the daily or H4 is a directional-analysis element: it tells you where price is likely to return before moving on, and it is often a target in itself ("price is going up to close the daily gap"). A gap on the M15 and M5 is an execution tool: that's where you look for a specific entry after the higher timeframe has told you what to trade. The practical division of labor looks like this: daily — direction and targets, H4/H1 — the zones where you wait for price, M15/M5 — the entry formation and confirmation. Sticking to this hierarchy protects you from the most common beginner mistake: trading M1 gaps against an H4 gap hanging a hundred dollars higher.
As for markets — ICT built the concept on US indices, but the mechanics of imbalance are universal, because they come from the very nature of price delivery, not from the quirks of any instrument. On crypto it works exceptionally cleanly for two reasons. First, BTC and ETH regularly produce displacement — violent, one-sided moves during liquidations of leveraged positions, which leave large, clean gaps. Second, the market runs 24/7, so gaps don't get mixed up with the weekend gaps known from traditional markets — every zone on the chart is a real imbalance, not an artifact of a session close. Do keep liquidity in mind, though: on low-cap pairs gaps print more often, but they also get ignored more often. The best reaction statistics belong to gaps on the most liquid pairs — and that's where you should learn this concept.
Common Mistakes
- Trading every gap. FVGs print by the dozens, especially on low timeframes. Without the HTF direction filter and the premium/discount zone, they're coin flips.
- Marking gaps inside consolidation. In a range, every little burst of price leaves a gap the market ignores moments later. Gaps have value inside a directional impulse, not in chop.
- Entering on the mere touch of the zone. The gap is where you look for a signal — not a signal in itself. Without lower-timeframe confirmation you're entering against momentum.
- Measuring the gap body to body instead of wick to wick. It inflates the zone and ruins both the entry and the stop.
- Stop loss at the edge of the gap. Price's second visit to the zone often reaches deeper than the first. The stop belongs in the space BEYOND the gap, with a buffer.
- Confusing a regular FVG with an inversion. A gap broken by a body close in the opposite direction stops being support/resistance in the original direction and flips polarity — that's an Inversion FVG, traded exactly the other way around.
- Ignoring freshness. A gap being tested for the third time has a completely different (lower) value than an untouched one. Each fill consumes part of the imbalance.
The Fair Value Gap is the first letter of the ICT alphabet — but, like any letter, it only makes sense in a sentence. The next levels of mastery are grading gap strength (valid vs weak FVG), precise entries from the middle of the zone (Consequent Encroachment) and the situations where a gap fails and switches sides (Inversion FVG). Master them in that order, and the rectangles on your chart will stop being decoration.
FAQ
What is a Fair Value Gap (FVG)?
What is the difference between a bullish and a bearish FVG?
Is every FVG on the chart worth trading?

Trader and founder of Strefa Tradingu. He’s been breaking crypto down on YouTube for years — no hype, no signals, with a focus on market structure and risk management.
🎁 Grab Strefa’s free TradingView indicators
Drop your email — we’ll send you links to our free TradingView indicators plus a no-fluff starter kit. Zero spam.
You’re joining the Strefa Tradingu list. Unsubscribe with one click, anytime.Check your inbox (and the Spam/Promotions folders) and add us to your contacts.