Turtle Soup — Hunting False Breakouts (and Where the Name Comes From)
In the 1980s Richard Dennis proved that trading could be taught to "people off the street": his "Turtles" made millions mechanically buying every breakout of the 20-day high and selling every breakout of the 20-day low. The strategy became so famous that years later the whole market knew exactly where the Turtles — and the crowds imitating them — kept their orders. And when everyone knows where someone's stops are, sooner or later somebody goes to get them. That's how Turtle Soup was born: a strategy that, instead of trading breakouts, hunts the failed ones — symbolically "cooking turtle soup". In this article we show what the setup looks like in its ICT edition, how to confirm it step by step, and why its natural habitat is a ranging market while its enemy is a strong trend.
What Turtle Soup Is
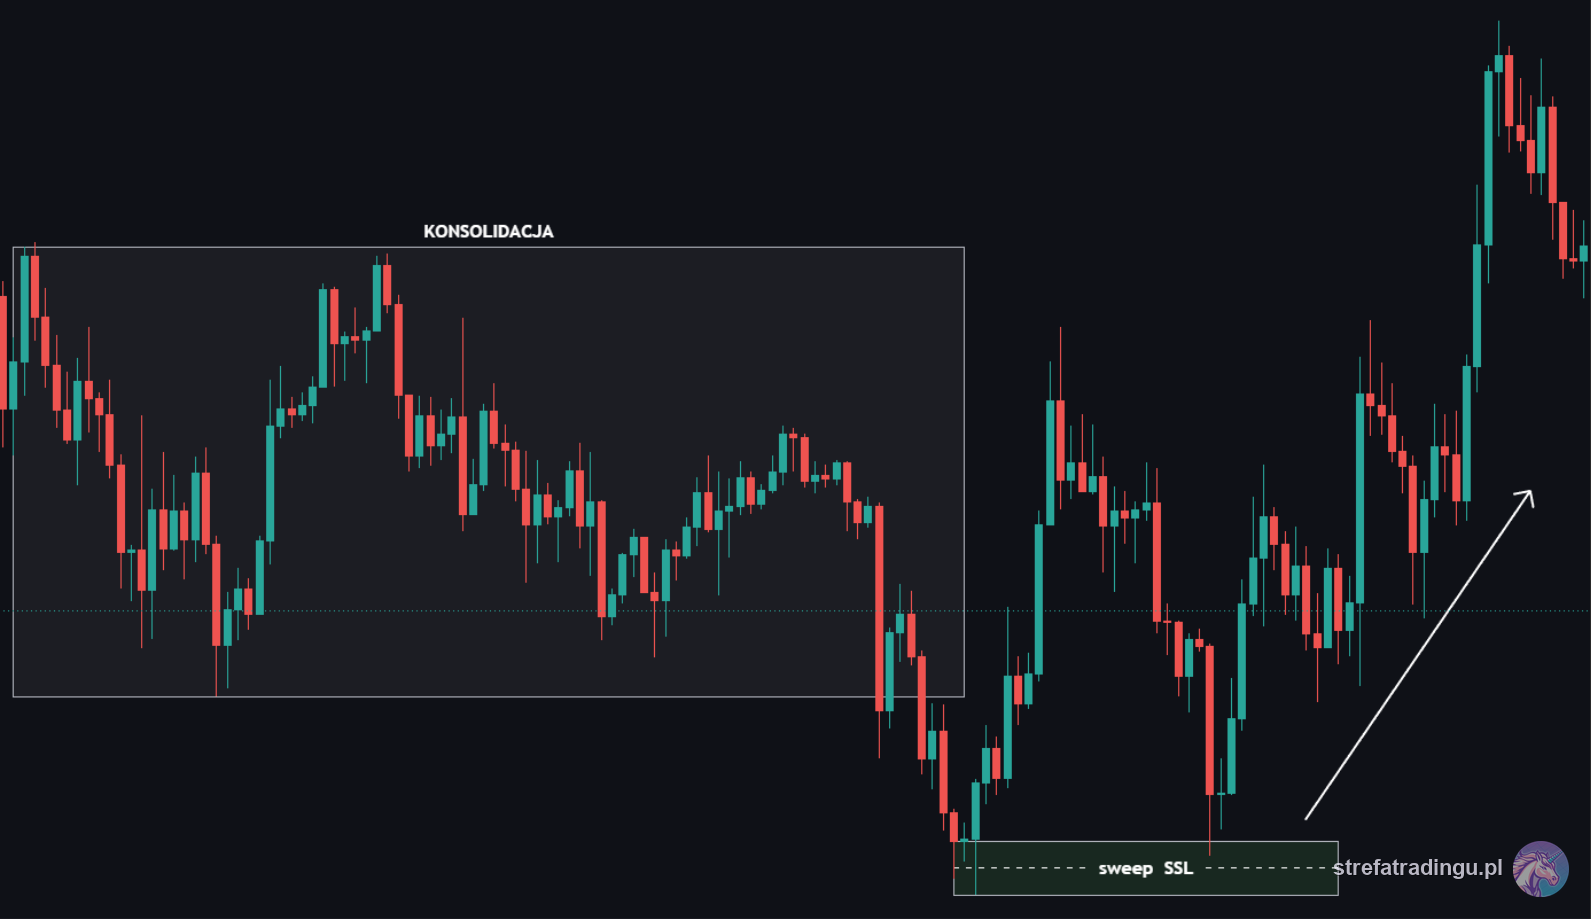
Turtle Soup is a failed-breakout reversal setup. The anatomy is always the same: the market pierces a significant, universally visible extreme — in the original version the 20-day high or low — collects the orders resting beyond that level, then finds no continuation and returns into the range. That return is the trade: you play against the direction of the breakout, targeting the opposite side of the range.
It's worth being honest about the lineage, because the internet likes to oversimplify it. The idea and the name were popularized by Linda Raschke and Larry Connors in the classic book "Street Smarts" (1995) — as a direct answer to the Turtle strategy of Dennis and Eckhardt. Michael Huddleston (ICT) adapted Turtle Soup into his own framework and explained WHY it works in the language of liquidity: a 20-day extreme is not "resistance" but a huge, publicly visible liquidity pool. Above old highs hang shorts' stops and breakout-long orders; below old lows — the mirror image. An institution that wants to build a large position needs exactly that cluster of orders as a counterparty. So a break of the level is often not the start of a trend but a transaction collecting liquidity — after which price goes back where it came from.
The key distinction: sweep versus genuine breakout. After a sweep, price pierces the level with a wick or a short impulse and quickly returns — the bodies close back inside the range. After a genuine breakout, price closes beyond the level and accepts the new territory. Telling those two scenarios apart is a separate, important topic — we take it apart in Liquidity Sweep vs Liquidity Run. Turtle Soup only exists in the first one.
The setup has two mirror variants. Bullish Turtle Soup: a false breakout of the LOW — price dives below the 20-day minimum (or another significant low), collects sell-side liquidity and returns into the range; you go long targeting the upper part of the range. Bearish Turtle Soup: a false breakout of the HIGH — price pops above the 20-day maximum, collects buy-side liquidity and returns; you go short targeting the bottom of the range.
Setup Conditions Step by Step
Turtle Soup looks simple — "it broke out and came back" — but the difference between a setup and a gamble lives in the conditions. The checklist:
- Confirm a ranging environment on D1/H4. Turtle Soup feeds on a market oscillating between established extremes. A strong trend is the worst possible environment — breakouts there are more often real.
- Mark the significant extremes. The classic: the 20-day high and low. Intraday: the previous day's or week's high/low, the edges of a clear consolidation, equal highs/lows. The more "obvious" the level is to everyone, the more liquidity hangs behind it.
- Wait for the raid. Price must reach decisively beyond the level — not graze it, but genuinely collect the stops. The best sweeps happen in the London or New York killzone, when there is someone to hand the liquidity to.
- Confirm the breakout's failure. The diagnostic: the body close. A wick beyond the level + a body back inside the range = a Turtle Soup candidate. A body close beyond the level with acceptance of the new prices = the breakout may be real; you stand down.
- Drop to M5–M1 for an MSS against the direction of the breakout. A structure shift with displacement is the proper signal — the return below the level alone is not enough yet.
- Mark the entry zone from the displacement leg. The FVG or Order Block left by the structure-breaking candle (our SRL indicator draws these zones automatically).
- Enter on the retest of the zone, stop beyond the sweep extreme — with a buffer, because the wick sometimes gets extended by a second push.
- Target: the opposite side of the range or the nearest significant liquidity pool in the direction of the trade. Partial profit at mid-range is a sensible compromise.
Turtle Soup Across Scales — From 20 Days to a Single Session
The original 1990s version was precise: the signal forms when the market makes a new 20-day low or high, the previous such extreme is at least four sessions old — and the breakout fails immediately. That frame still works and has one big advantage: everyone can see a 20-day extreme, so the liquidity behind it is the deepest. On crypto, the equivalent is a swing Turtle Soup on D1: a sweep of a multi-week BTC low, a return into the range and weeks of upside — the best-known cycle bottoms looked exactly like that.
ICT stretched the same mechanics onto intraday scales. Instead of the 20-day extreme, the bait level becomes the previous day's high or low (PDH/PDL), the Asian Range extreme swept at the London open, or the edge of a morning consolidation broken in the New York killzone. The selection rule is always the same: the older and more obvious the level, the more orders behind it — and the stronger the reaction after a failed breakout.
A practical hierarchy for crypto looks like this: 20-day and weekly extremes (swing setups, targets measured in days), PDH/PDL (day-trade setups, targets in hours), the Asian session high/low (early-session scalps). Beginners are best served by the middle of that ladder — PDH/PDL gives enough occurrences to build statistics and enough liquidity for reactions to be readable. And regardless of scale, the same time filter applies: a sweep in the London or New York killzone has real volume behind it; a sweep at 9:00 PM ET, deep in the overnight lull, is usually just thin-book noise.
A Worked Example on BTC
BTC has been consolidating for eleven days in a 114,500–118,900 band. The top of this range is also the highest point of the last 20 days — above it, at 119,000–119,200, sit clearly visible equal highs. Textbook buy-side liquidity: shorts' stops plus the orders of breakout hunters. D1 is trendless — the ranging environment is confirmed.
Tuesday, 9:45 AM ET (New York killzone): BTC aggressively breaks 118,900 and reaches 119,350. Social media announces the "breakout". Volume is high, but the H1 candles can't manage a close above the level — after 40 minutes the bodies are back inside the range. This is the moment for suspicion, not action.
10:30 AM ET: on M5, a full-bodied bearish candle breaks the last higher low — MSS to the downside. The displacement leg leaves a bearish FVG at 118,750–118,950.
10:55 AM ET (entry): pullback into the gap. Short at 118,850, stop above the sweep's wick (119,500), target at the lower edge of the range — 115,200, just above the equal lows (we target IN FRONT OF the obvious level, not beyond it).
Thursday morning: price reaches 115,200. RR came out around 1:5 — unusually high, because the range was wide; a typical Turtle Soup delivers 1:2 to 1:3. The essence, though, wasn't the result but the process: we didn't guess the top — we waited for the breakout to prove its own failure.
Realistic Expectations
Turtle Soup is considered one of the "safer" ICT setups, and with the full checklist, in a ranging environment, its large-sample statistics can be very decent (reported figures around 60–70% at 1:2–1:3 RR). But it's conditional statistics: trade it in a trend, without MSS confirmation or in dead hours, and the edge evaporates faster than it appeared. Losing streaks are unavoidable — especially since the setup by definition trades against momentum. Before risking real capital, collect at least a few dozen logged setups on demo and check your own numbers. A setup ≠ a guarantee; it's only a repeatable scenario with — given the conditions — positive expected value.
Common Mistakes
- Trading Turtle Soup in a strong trend. In a trend, breakouts are often real — this is the most common cause of losing streaks on this setup. Environment first, formation second.
- No body-close discipline. Entering a short while price is still holding above the level is knife-catching. You wait for proof of the breakout's failure, not for a hunch of it.
- Skipping the MSS. The return into the range alone can be a trap — the market can run a second, deeper sweep. The structure shift on the lower timeframe is the filter that removes most of those cases.
- A stop skin-tight beyond the extreme. The sweep's wick gets extended. An ATR-based buffer is the cost of participation, not an indulgence.
- A target beyond the obvious level. If everyone can see the equal lows, price often turns just in front of them. Take profit before the liquidity magnet, not past it.
- Confusing scales. A sweep of a 20-day extreme on H4 is a different league from a sweep of the last hour's high on M1. The older and more visible the extreme, the more liquidity — and the stronger the potential reaction.
Turtle Soup is a lesson in humility packed into a single setup: the market prefers to move in its true direction only after it has taken money from those who were sure of theirs. If you want to build a complete workflow around it, read about liquidity pools — to know where the market hunts, about the difference between a sweep and a run — to tell a trap from a genuine breakout, and about the Judas Swing — the twin manipulation, only tied to the session open. And on the chart, start with one thing: mark the 20-day high and low on BTC and simply watch what happens every time they get violated. The soup gets cooked more often than you think.
FAQ
What is the Turtle Soup strategy?
Why is it called Turtle Soup?
When does Turtle Soup work best and when does it fail?

Trader and founder of Strefa Tradingu. He’s been breaking crypto down on YouTube for years — no hype, no signals, with a focus on market structure and risk management.
🎁 Grab Strefa’s free TradingView indicators
Drop your email — we’ll send you links to our free TradingView indicators plus a no-fluff starter kit. Zero spam.
You’re joining the Strefa Tradingu list. Unsubscribe with one click, anytime.Check your inbox (and the Spam/Promotions folders) and add us to your contacts.