Optimal Trade Entry (OTE) — The Fibonacci Entry in the 62–79% Zone
Fibonacci retracements are probably the most used and most misused tool in retail trading: stretched over a random move, with an entry "because it touched 61.8%". Michael Huddleston (ICT) took the same tool and made something different out of it — Optimal Trade Entry: a strictly defined 62–79% zone with a 70.5% sweet spot, measured exclusively on an impulse that has a liquidity sweep and a structure shift behind it. The difference sounds cosmetic and is fundamental: the fib stops being a fortune-teller and becomes a ruler laid against a move that is already known to mean something. In this article we set the levels the ICT way, define the conditions under which the zone actually works, and play through an example on BTC.
What OTE Is
Optimal Trade Entry is the retracement zone between 62% and 79% of the last significant impulse — the area where a deep pullback most often ends its run before the market resumes its original direction. The middle of the zone, the 70.5% level, is ICT's designated sweet spot: halfway between 62 and 79, a statistically frequent turning point.
Why so deep? For two reasons. First — the premium/discount logic: a retracement below 50% of a bullish impulse means you're buying in the discount zone, i.e. cheap relative to the range; the 62–79% zone is discount with an extra rebate, yet with the move's structure still intact. Second — risk geometry: an entry near 70.5% puts the stop just beyond the start of the impulse (beyond the 100% retracement), so it's tight, while the target sits at the top of the range or further — which means decent RR falls out of the construction itself, without bending any levels.
The TradingView tool settings the ICT way (the fib pulled along the impulse: for a long from the low to the high, for a short from the high to the low):
| Level | Meaning |
|---|---|
| 0 | end of the impulse — first take-profit |
| 0.5 | equilibrium — the premium/discount boundary |
| 0.62 | start of the OTE zone |
| 0.705 | OTE sweet spot |
| 0.79 | end of the OTE zone |
| 1 | start of the impulse (stop goes beyond it) |
| −0.5 / −1 | extensions — targets 1 and 2 |
The key caveat that separates OTE from "drawing fibs on everything": the zone only makes sense on a properly chosen impulse. The best candidate is the leg that formed after a liquidity sweep and after a structure shift (MSS) — a move backed by a genuine change in the direction of price delivery. The sequence looks like this: sweep of the low → MSS up → bullish impulse → and only ON THAT impulse do you measure the OTE, waiting for the pullback into 62–79%. OTE is also used in a simpler role — a pullback entry in an established trend — but the post-sweep, post-MSS variant is statistically the cleanest.
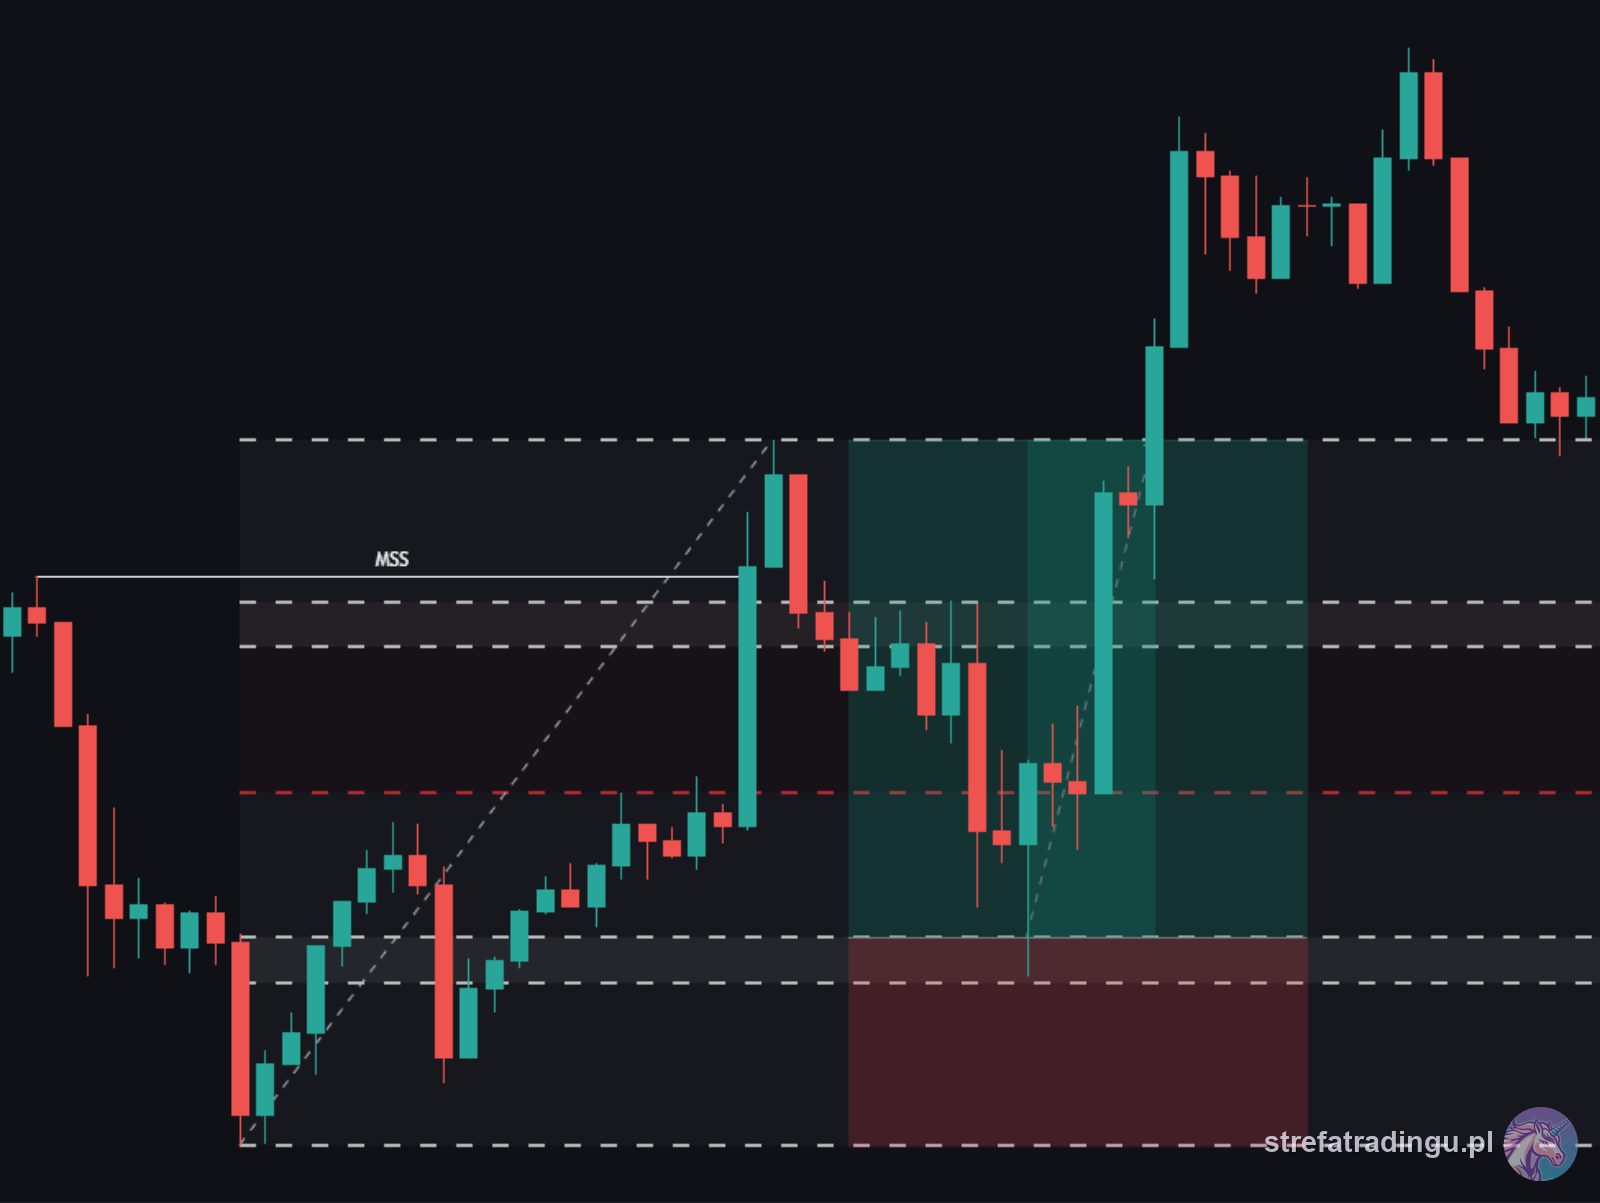
Setup Conditions Step by Step
- Set the bias on D1/H4. OTE is above all a continuation tool — you trade it in the direction of the higher timeframe. The counter-trend variant needs a strong HTF reason (e.g. a reaction at a D1 zone).
- Find the right impulse. The ideal: a leg after a liquidity sweep and an MSS, with clear displacement — preferably leaving an FVG along the way. An impulse without context = a zone without an edge.
- Stretch the fib over the impulse. Long: from the low (1.0) to the high (0). Short: from the high to the low. Measure wick to wick.
- Mark the 0.62–0.79 zone with the 0.705 line. That's your area of interest; anything shallower than 0.62 isn't OTE yet, deeper than 0.79 is a warning sign that the pullback may be something more.
- Check for confluence. The strongest OTE zones coincide with another argument: an FVG or Order Block inside 62–79% (our SRL indicator draws them automatically — if a gap lands in the zone, you have a double reason). An overlap with a killzone adds a third dimension: time.
- Wait for the pullback into the zone. No chasing price. Some impulses will never return to OTE — that's the cost of selectivity, not a flaw of the model.
- Wait for confirmation inside the zone. A price rejection (a clear wick), or better a mini-MSS on M5–M1 in the direction of the trade. A mere touch of 0.705 is an invitation to observe, not to enter.
- Entry, stop, targets. Entry inside the zone (around 0.705); stop beyond the impulse extreme (beyond the 1.0 level) with a buffer; first target at 0 (the range high/low), further ones at −0.5 and −1 if HTF liquidity allows.
- Management. Once 1:1 RR is reached, it's reasonable to move the stop to break-even — a deep OTE entry allows that without strangling the position.
OTE Across Timeframes and Trading Styles
One of OTE's greatest advantages: the same levels work at every scale; only the size of the range and the horizon of the trade change.
Scalping (M5–M1): impulses from killzones, pullbacks lasting minutes, targets at the 0 level. Here OTE most often pairs with time-based models — an impulse from the Silver Bullet window can give a pullback into 62–79% within the same hour. It demands the most experience, because low-timeframe noise produces plenty of "false impulses".
Intraday (M15–H1): the most popular application and the best training ground. An impulse from the London-morning MSS, a pullback during the pre-New York lull, continuation in the New York killzone — that rhythm repeats on BTC surprisingly often. The ranges are big enough that a stop beyond the impulse extreme doesn't hurt, and the −0.5 targets land within reach of a single day.
Swing (H4–D1): OTE measured on legs lasting days or weeks. Here the 62–79% zone often coincides with major HTF zones — D1 Order Blocks, weekly FVGs — and it's precisely those overlaps that produce the trades held for a week or longer. The patience required is brutal (you wait days for the pullback), but the RR geometry can be the best of all scales.
Regardless of scale, the same nesting rule applies: you measure the impulse on your working timeframe, collect confirmation in the zone one or two timeframes lower, and set the bias one or two higher. Mixing those roles (e.g. measuring the impulse on M1 with a bias from M5) is a recipe for zones nobody but you can see.
A Worked Example on BTC
Bias: bullish — D1 in a trend, H4 has just reacted to a discount zone after a correction.
London killzone: BTC sweeps the overnight low of 116,200, dipping to 116,050, then recovers and at 3:40 AM ET breaks the last lower high on M15 — MSS to the upside. The impulse carries price to 118,400, leaving a bullish FVG at 116,900–117,150 along the way. We have a leg with full context: sweep, structure shift, displacement.
The measurement: fib from 116,050 (1.0) to 118,400 (0). The OTE zone: 0.62 = 116,943, 0.705 = 116,743, 0.79 = 116,544. Note the confluence: the upper part of the OTE zone overlaps the 116,900–117,150 FVG — the entry zone narrows to 116,900–116,943.
7:20 AM ET (New York killzone): the pullback reaches 116,920 — inside the OTE+FVG overlap. M5 prints a clear rejection and a break of the pullback's local high. Long entry 116,940, stop below the impulse low (115,850 — below 1.0 with a buffer), first target 118,400 (the 0 level), second at −0.5 = 119,575, just under the H4 equal highs.
That afternoon: the first target is delivered (RR ~1:1.3, half the position off + stop to break-even), and the next morning the market reaches 119,500 — the second target closes the rest at a combined RR of ~1:2.4. The "deep and boring" entry turned out to be the calmest part of the whole trade.
Common Mistakes
- A fib on a random move. The most common sin: measuring every M5 leg and "trading the 70.5%" without a sweep, without an MSS, without a bias. OTE without context is decoration.
- Entering on the touch of the line. The 0.705 level is a reference point, not a button. Price routinely pricks it with a wick by a dozen or so ticks — confirmation inside the zone is part of the setup.
- Wrong choice of extremes. A fib measured over candle bodies, from the wrong low, or on a leg stitched together from two impulses gives a zone the market doesn't see. The impulse must be a single, readable leg, measured wick to wick.
- A stop inside the range. A stop "below the OTE zone" instead of beyond the impulse extreme tends to get taken out by a final extension of the pullback to 0.79–0.9. The stop's place is beyond 1.0, with a buffer.
- Trading OTE against the HTF. A deep pullback in a downtrend is often not a "long opportunity" but a rest stop before continuation. The bias filter is non-negotiable.
- Ignoring time. A zone reached in dead hours reacts weakly. OTE + killzone is a completely different statistic from OTE touched in the middle of the overnight lull.
- Treating 62–79% as a guarantee. Some pullbacks cut through the zone and invalidate the impulse — that's why the stop exists. OTE improves risk geometry; it doesn't promise the outcome of any single trade.
OTE closes a logical chain that starts much earlier than the moment you stretch a fib: premium and discount explains WHY a deep retracement is attractive, the MSS tells you WHICH impulse to measure at all, and the FVG and the Unicorn Model show how to narrow the entry zone with confluence. A starter exercise: go back 30 days on the BTC chart and find every impulse after a sweep and an MSS on M15. Stretch the fib over them and check how many pullbacks turned inside 62–79% — and how many never got there or cut right through. That personal statistic will tell you more about OTE than any course — and teach you the most important lesson: the zone is a place for a decision, not the decision itself.
FAQ
What is Optimal Trade Entry (OTE) in ICT?
Where does the 70.5% level come from?
Does OTE work without a liquidity sweep and a structure shift?

Trader and founder of Strefa Tradingu. He’s been breaking crypto down on YouTube for years — no hype, no signals, with a focus on market structure and risk management.
🎁 Grab Strefa’s free TradingView indicators
Drop your email — we’ll send you links to our free TradingView indicators plus a no-fluff starter kit. Zero spam.
You’re joining the Strefa Tradingu list. Unsubscribe with one click, anytime.Check your inbox (and the Spam/Promotions folders) and add us to your contacts.