Power of 3 (AMD) — Accumulation, Manipulation, Distribution
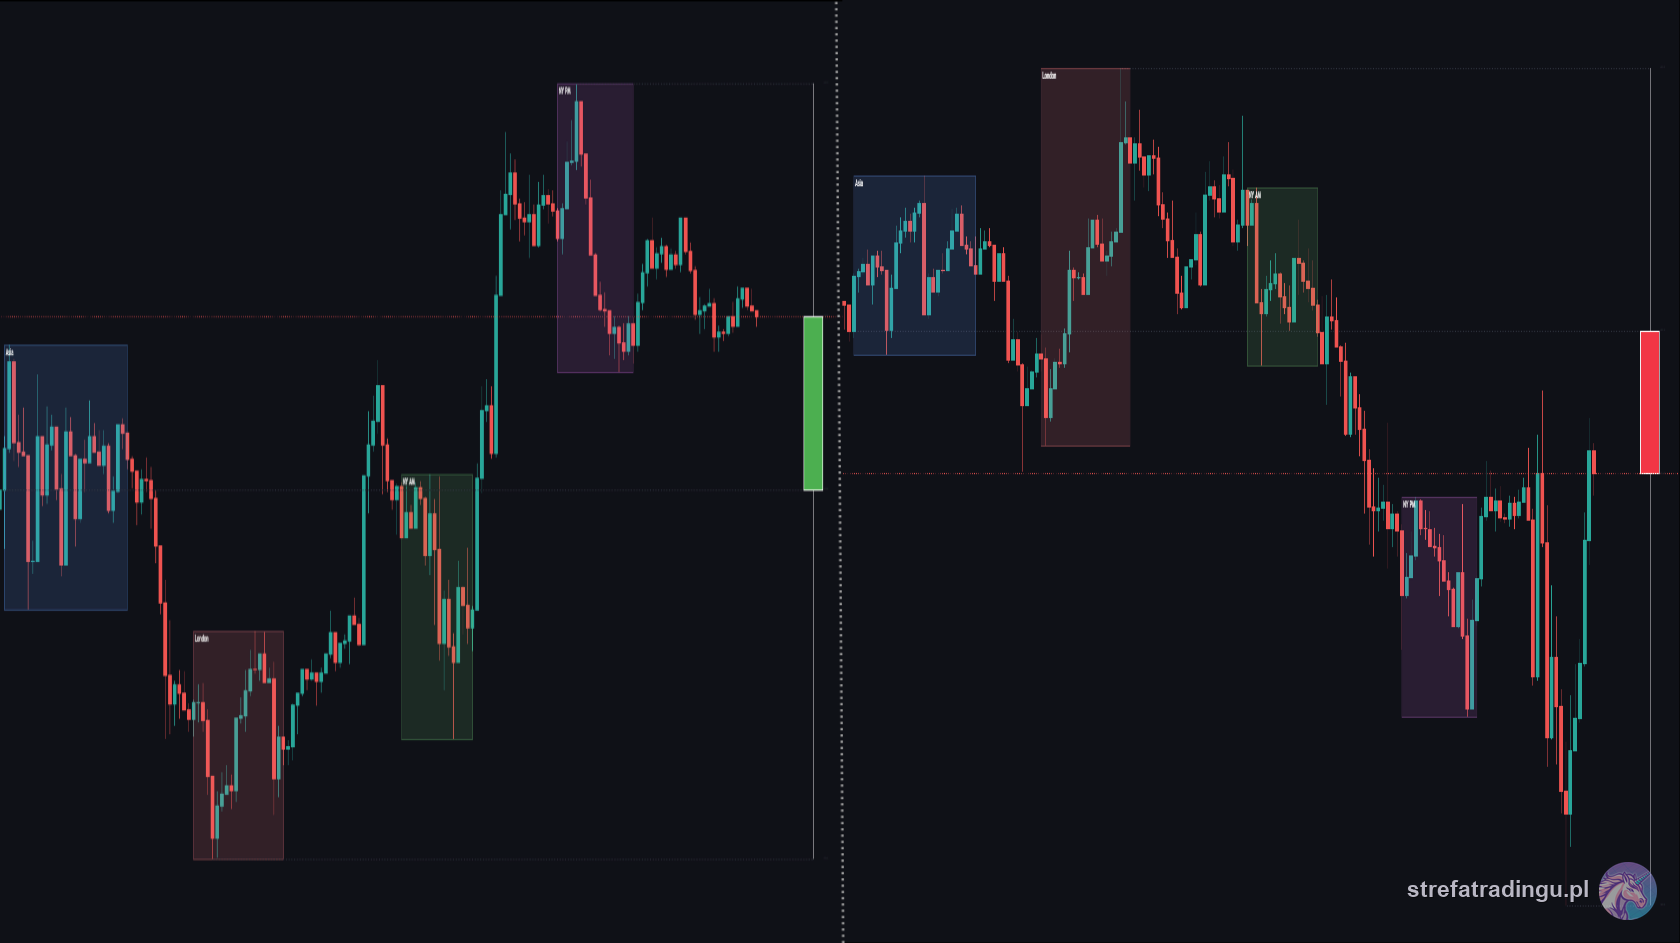
Open any clearly bullish daily candle on BTC and look at its lower wick. In most cases you'll see the same script: the market opened, sat still for a while, then dived below the open — shaking buyers out of their positions and pulling breakout hunters into shorts — and only from that low did the real rally begin, the one that built the body. That's not a coincidence; it's a repeatable skeleton of price delivery that Michael Huddleston (ICT) named Power of 3, AMD for short: accumulation, manipulation, distribution. In this article we take the cycle apart — you'll learn how to recognize each phase, why manipulation looks like a breakout (and works precisely because of it), and how to build a plan in which you only trade the phase that pays.
What Power of 3 Is
Power of 3 is a model describing the anatomy of a single candle — usually the daily one, although the mechanics are fractal and work on the weekly candle or a single session too. Every complete market move consists of three sequential phases:
Accumulation begins at the open (for the daily candle, ICT anchors it at midnight New York time — 00:00 ET). Price builds a tight, horizontal range around the opening price. It looks boring — and that's the point: institutions quietly build positions at favourable prices while retail places orders at the edges of the range with stops just behind them. Those stops are the fuel for the next phase.
Manipulation is a false breakout of the accumulation range — a move in the direction OPPOSITE to the true direction of the day. On a bullish day, manipulation goes down: it collects the stops of early buyers and pulls breakout traders into shorts. On a bearish day — up, symmetrically. The mechanism is pure liquidity: breaking the edge of the range triggers an avalanche of retail orders, which institutions use as the counterparty for their own positions. This phase is the twin of the Judas Swing concept — the Judas is simply AMD's manipulation seen through the lens of the session open.
Distribution is the only phase that pays. After harvesting the manipulation liquidity, the market reverses and delivers the real move of the day — in the direction of the bias, toward external liquidity: old highs on a bullish day, old lows on a bearish one. Distribution is what forms the body of the daily candle; manipulation stays on the chart as the wick.
Look at the daily candle once more: a wick on one side, a body on the other. Wick = manipulation. Body = distribution. The entire model fits inside the anatomy of a single candle.
Setup Conditions Step by Step
Power of 3 is a directional model — without an established bias you can't tell manipulation from a genuine breakout. Here's the full sequence:
- Set the day's bias on D1/H4 before the session. Structure, the liquidity the market "wants" to reach, premium/discount context. A day without a readable bias = a day without AMD.
- Mark the opening price. For the full daily cycle: midnight New York time (00:00 ET). For a session cycle: the open of the session you're trading. Accumulation will form around this level.
- Wait for accumulation. A tight, horizontal range at the open. Don't position inside it — at this stage you don't yet know which edge the market will sweep.
- Mark the edges of the range. The high and low of accumulation are the levels manipulation will hunt — together with the liquidity pools just beyond them.
- Wait for manipulation — a move against your bias. Bullish bias → watch for a dive below the open and below nearby old lows. Bearish bias → a spike above the open.
- Confirm the sweep. Price must refuse to continue past the swept extreme and come back into the range. If it closes with its body beyond the level and stays there — that may be a genuine breakout, not manipulation.
- Drop to M5–M3 for confirmation. A Market Structure Shift in the direction of the bias is the signal that manipulation has ended and distribution is beginning.
- Mark the entry zone from the displacement leg. The FVG, Order Block or breaker left behind by the structure-breaking move.
- Enter on the pullback into the zone, stop beyond the manipulation extreme (with a buffer — sweeps get extended).
- Target: the opposite end of the day's expected range or the nearest significant liquidity pool in the direction of the bias.
Timing matters enormously here: manipulation most often lands in the London killzone (2:00–5:00 AM ET), and distribution develops through London and the New York morning. AMD "traded" in the dead hours of the Asian afternoon is asking for trouble. You can also check the current AMD phase of the ongoing session live in the NEXUS market clock widget — it tracks both the session windows and the clock shift that wrecks the statistics of the inattentive twice a year.
AMD Is Fractal — Three Scales of the Same Cycle
The strength of Power of 3 is that the same skeleton repeats across time scales — you only change the anchor of the open.
The daily scale (open at 00:00 ET) is the classic variant: accumulation during the Asian night, manipulation most often around the London open, distribution through London and New York. This is the cycle that builds the anatomy of the D1 candle — the wick from manipulation, the body from distribution.
The weekly scale anchors to the weekly open (Sunday 6:00 PM ET). Monday and Tuesday morning often play the role of accumulation and manipulation — hence the well-known ICT observation that the high or low of the week very often forms on Tuesday — while the middle of the week delivers distribution. Once you understand this scale, you stop panicking when Monday goes "the wrong way".
The session scale is AMD in miniature: a single session (e.g. New York) can play out its own accumulation at the open, manipulation in the first hour and distribution into the close. On this scale the cycle links up with the Silver Bullet windows — the NY AM hour is often exactly the moment of transition from manipulation into distribution.
The practical consequence of fractality: before you trade AMD intraday, check which phase the higher scale is in. A long during a bullish daily distribution has a tailwind; the same long during a weekly manipulation phase is trading against the larger cycle. A conflict of scales is the most common reason a "textbook" setup fails.
A Worked Example on BTC
Bias for the day: bullish — D1 in a structure of higher lows, a readable pool of liquidity above the market at the 119,800 equal highs, and the previous day closed with strong demand.
12:00–3:00 AM ET (accumulation): after the New York midnight, BTC builds a 118,100–118,450 range around the open. Boring. We mark the edges and the old lows below: 117,900 from the previous afternoon.
3:20 AM ET (manipulation): with the London open, price breaks the lower edge of the range and dives to 117,820 — below the old lows. Retail sees a "bearish breakout" and sells; the stops of early buyers have just fed the order book. A wick, no continuation, back inside the range within fifteen minutes or so.
3:45 AM ET (distribution begins): on M5, a bullish candle with displacement breaks the last local high — MSS to the upside. The leg leaves a bullish FVG at 118,050–118,180.
4:10 AM ET (entry): pullback into the gap. Long at 118,120, stop below the manipulation low (117,750), target at the 119,800 equal highs.
9:40 AM ET: the New York morning delivers the sweep of 119,800. The daily candle is left with a long lower wick (manipulation) and a full green body (distribution). RR around 1:4 — but the key wasn't a forecast, it was patience: letting the market spring its trap on others before committing yourself.
It's worth stressing what this scenario did NOT include: an entry during accumulation "because it's cheaper", a short on the breakdown of the low "because momentum", or averaging down during the manipulation. The entire trade is one click — after the full set of conditions. That's the difference between trading the model and trading emotions.
Common Mistakes
- Trading the manipulation as a breakout. Manipulation looks like a breakout by definition — that's what makes it effective. There's one filter: direction relative to the bias. A breakout against the bias is suspect number one.
- No bias. Without direction from the higher timeframe, manipulation and distribution are indistinguishable. AMD without a bias is guesswork dressed up in nice terminology.
- Entering right after the sweep, without an MSS. The return into the range alone isn't enough — sweeps get extended with a second leg. Structure on M5 must break before you click.
- A stop inside the manipulation range. The sweep candle often reaches a few ticks further than it "should". The stop belongs beyond the wick of the manipulation extreme, with a buffer.
- Forcing the model every day. There are days without a readable accumulation, news days that break the sequence and consolidation days when AMD simply doesn't occur. The model describes many days in the market — not every day.
- Expecting the perfect textbook cycle. The real market can print a double manipulation (two sweeps) or a shallow accumulation. We trade the principle, not the picture from the textbook — which is why the MSS confirmation is non-negotiable.
Power of 3 is the map on which other ICT concepts suddenly make sense: the Judas Swing turns out to be manipulation at the session open, killzones tell you WHEN each phase usually plays out, and liquidity pools explain WHY the market makes the false move in the first place. Start with a simple exercise: for two weeks, mark on closed BTC daily candles where accumulation, manipulation and distribution were. Once you start seeing the cycle in hindsight, you'll learn to wait for it live — and that's a completely different game from chasing every breakout.
FAQ
What does AMD stand for in trading?
Which phase of Power of 3 do you actually trade?
What timeframe should you use to read the AMD phases?

Trader and founder of Strefa Tradingu. He’s been breaking crypto down on YouTube for years — no hype, no signals, with a focus on market structure and risk management.
🎁 Grab Strefa’s free TradingView indicators
Drop your email — we’ll send you links to our free TradingView indicators plus a no-fluff starter kit. Zero spam.
You’re joining the Strefa Tradingu list. Unsubscribe with one click, anytime.Check your inbox (and the Spam/Promotions folders) and add us to your contacts.